Hi POCUS enthusiasts,
Thanks again to the more than 20 participants in the online voting for last week’s case! For those who have yet to sign up, just go to westernsono.ca and insert your name and email into the text box on the right side of the webpage. Then get ready to flex your POCUS muscles and post your answers/votes. Or click here to access the case directly: https://westernsono.ca/category/cases/
The Case
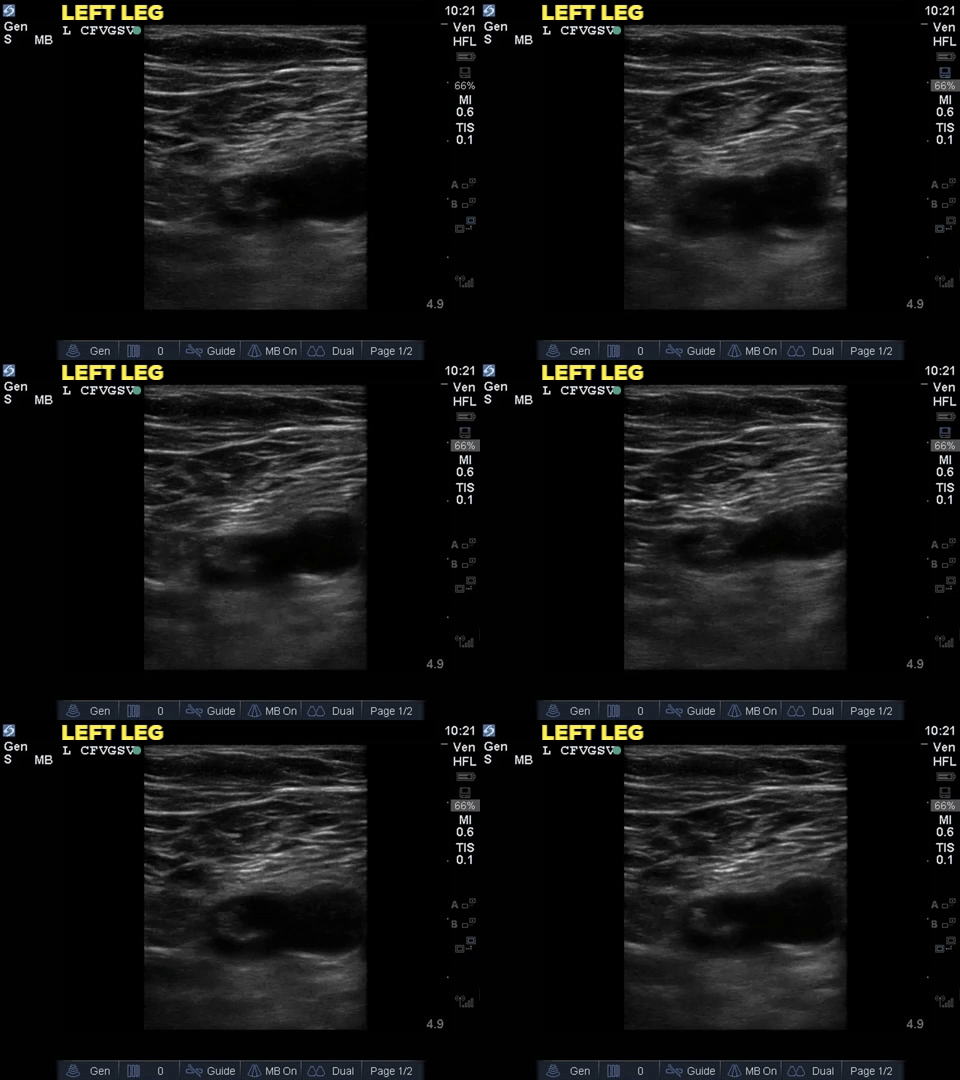
A 58 year old woman with lymphoma was admitted to the ICU following PEA cardiac arrest on the hematology unit. Recently she had been feeling well, mobilizing independently and on room air. Early in the morning she was found unresponsive and without vital signs in the early morning after which ACLS was initiated and ROSC achieved. A few hours after transfer to the unit the POCUS team obtained the following images:


Thoracic POCUS representative of all lung zones:


COTG & #EyeScandy
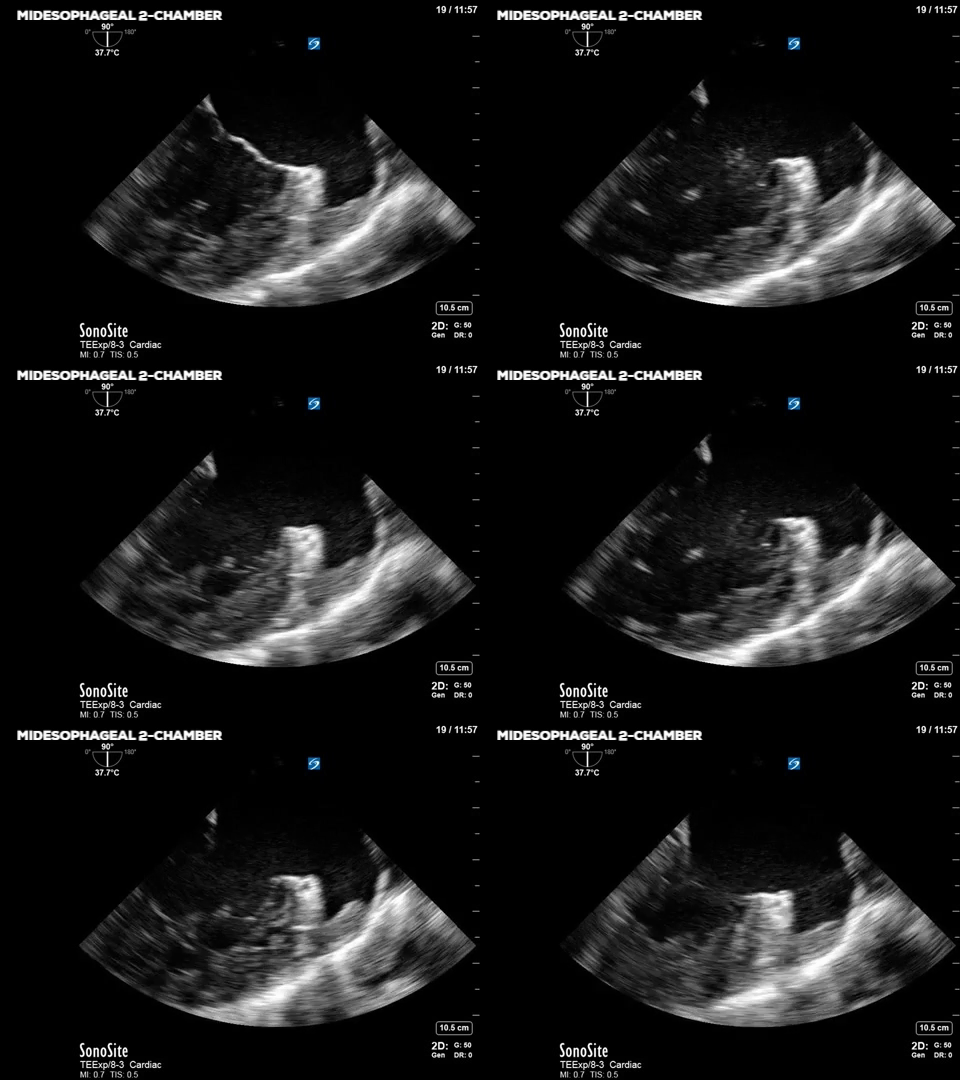
This week we are combining COTG with “Eye (s)Candy”, in honour of Katie Wiskar, our recent and to-be-returning CCUS fellow. A patient admitted with respiratory failure requiring intubation due to congestive heart failure had a history of atrial fibrillation. Due to his comorbidities he was both at high risk of stroke as well as major bleeding complications with anticoagulation. A POCUS TEE was performed to assess for left atrial appendage and help decide on anticoagulation while in the ICU.

And of course, as we have heard before, “if it moves put M-mode through it” and as included in Katie’s Ten Commandments of POCUS (#WWTLLIMM).


Answer to Last Weeks Case
A 42 year old female is admitted with ARDS and a pleural POCUS is performed. Due to difficulties identifying lung sliding, M-mode was used to evaluate for pneumothorax. Based on this image, does the patient have a pneumothorax? What is the 2D ultrasound image correlate of the vertical areas as shown by the arrows?

As the majority of you POCUS pros voted, this M mode is NOT consistent with pneumothorax. The vertical blurred areas marked by the yellow arrows are what lung pulse looks like on M mode. It is however important to differentiate this from intermittent movement of the probe or the patient’s entire chest. You can confirm this by carefully looking at the near field of the M mode. The areas above the blurry vertical line (i.e. near field to the “lung pulse”) shows horizontal lines throughout the recording, not interrupted by blurring. This tells us that this movement artifact was caused by the pleural movement and not the chest wall or probe itself.
In the same patient the following images were obtained on the contralateral side. What is the volume of fluid that you would estimate in this pleural effusion? What considerations must you make when measuring and estimating the volume?

Although usually it’s adequate to qualitatively assess pleural effusion size sometimes it’s nice to be able to estimate pleural effusion volume. Several equations exist but the simplest ones use one measurement multiplied factor to give us the volume in milliliters. The distance here is the maximal distance between the mid-height of the diaphragm and visceral pleura (base of lung). In a study by Usta, et al, this distance in millimeters multiplied by 16 gave an accurate volume of pleural effusion fluid in litres, which in this case would be 611mL. Importantly the patients were spontaneously breathing and in the sitting position. See the attached article by Brogi et al (2017), for a review of POCUS assessment of pleural effusions in ICU patients.
Answer to Last Weeks COTG
What is the valvular abnormality? What limitation of pulsed wave doppler does this abnormality and image expose? What is the cardiac output in this patient?

This apical five chamber view has the pulse wave doppler gate placed in the left ventricular outflow tract. Without any accompanying ECG signal you should first identify systole denoted by the sharp triangular shaped envelope which shows flow moving away from the probe (i.e. downwards from the baseline or in a negative direction). This can be used to calculate the patient’s stroke volume, by determining the area under the triangle (aka velocity time integral) which is then combined in an equation with the LVOT diameter and heart rate to calculate cardiac output. For those of you wondering how those clever POCUS people came up with 8.8L/min watch this 10 minute video that will take you through how to do that: https://westernsono.ca/screencasts/echo/stroke-volume-determination/
*hint without the knowledge of this patient’s LVOT diameter they used an average diameter of 2cm which makes the calculation simple!
Now let’s turn our attention to the spaces between each systolic phase where there are areas of grey artifact throughout the entire height of the velocity graph. There are two things to recognize here: 1) there is movement of blood in the LVOT during diastole and 2) it’s of HIGH velocity. In this situation this is due to aortic regurgitation and should prompt you to use colour doppler to interrogate the function of the valve. One of the fundamental limitations of pulsed-wave doppler is that it is limited in the velocity that it can accurately measure. When the blood velocity exceeds this limit aliasing occurs. The slow-motion clip below demonstrates the torrential aortic regurgitation in this patient.

Take Home Points
- In sitting, spontaneously breathing patients, pleural effusion volume can be estimated by the following equation: Volume (mL) = 16 X distance (mm).
- When the velocity of a moving object exceeds the ability of pulsed-wave doppler to accurate measure it, aliasing artifact occurs.
- Remember Katie’s Ten Commandments of POCUS.
Thanks,
The WesternSono POCUS Team