The Case
This week’s COTW is a two-part special. This is a 70-year old man who presented with several days of diarrhea.
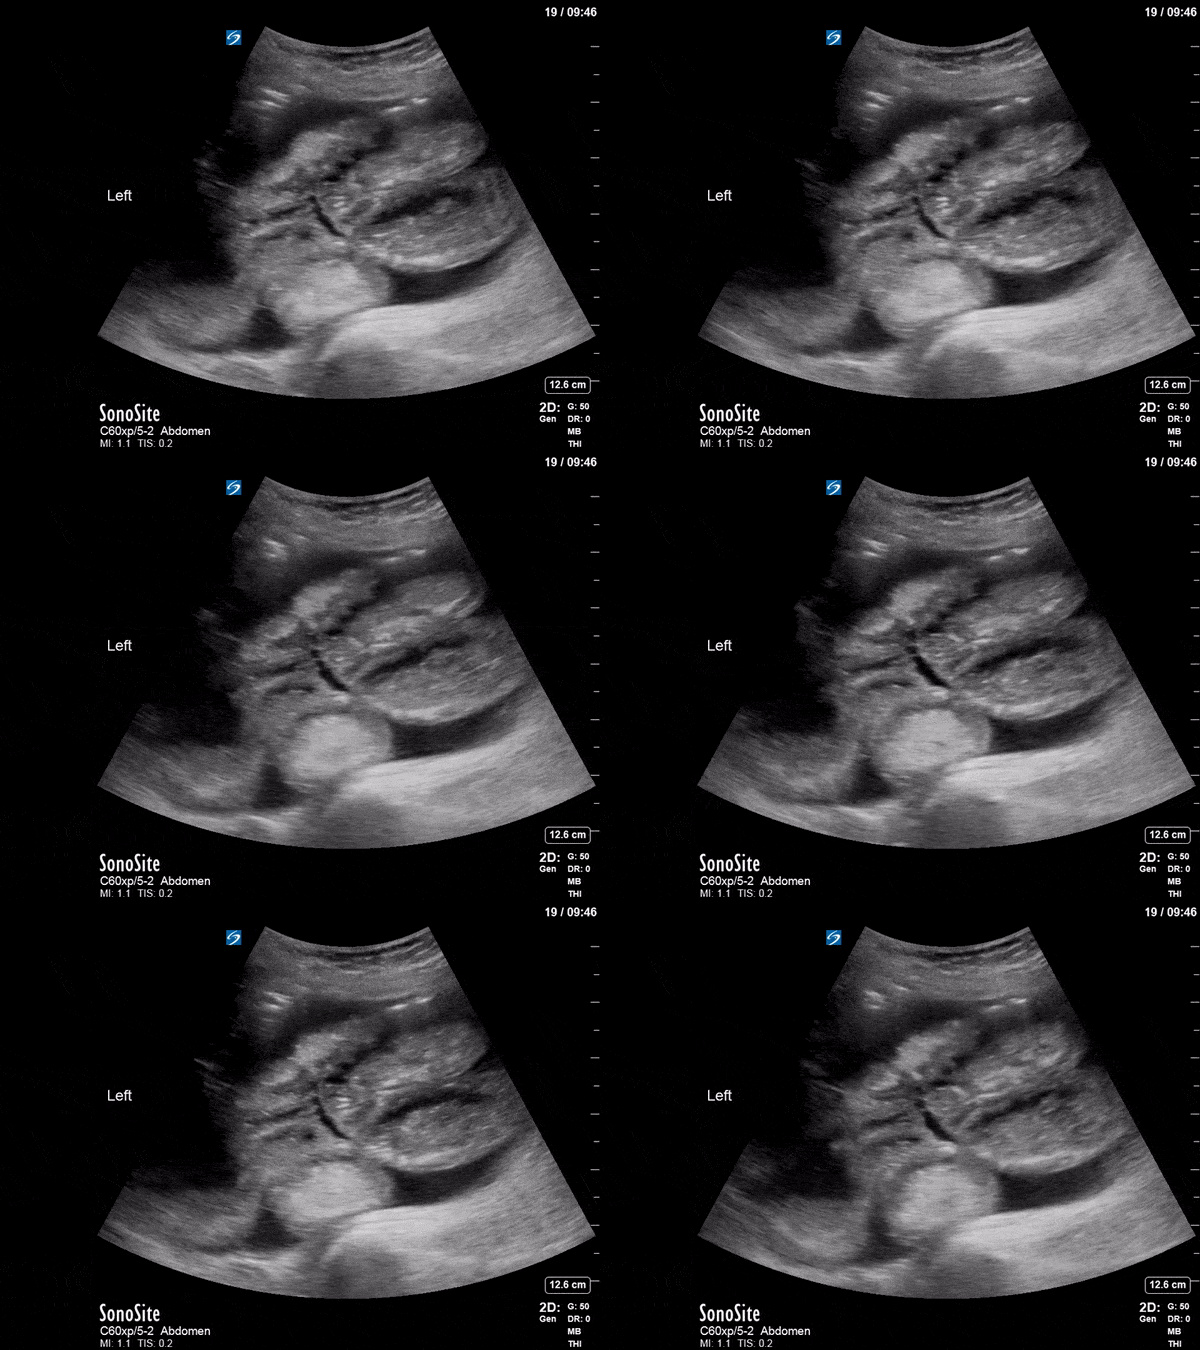
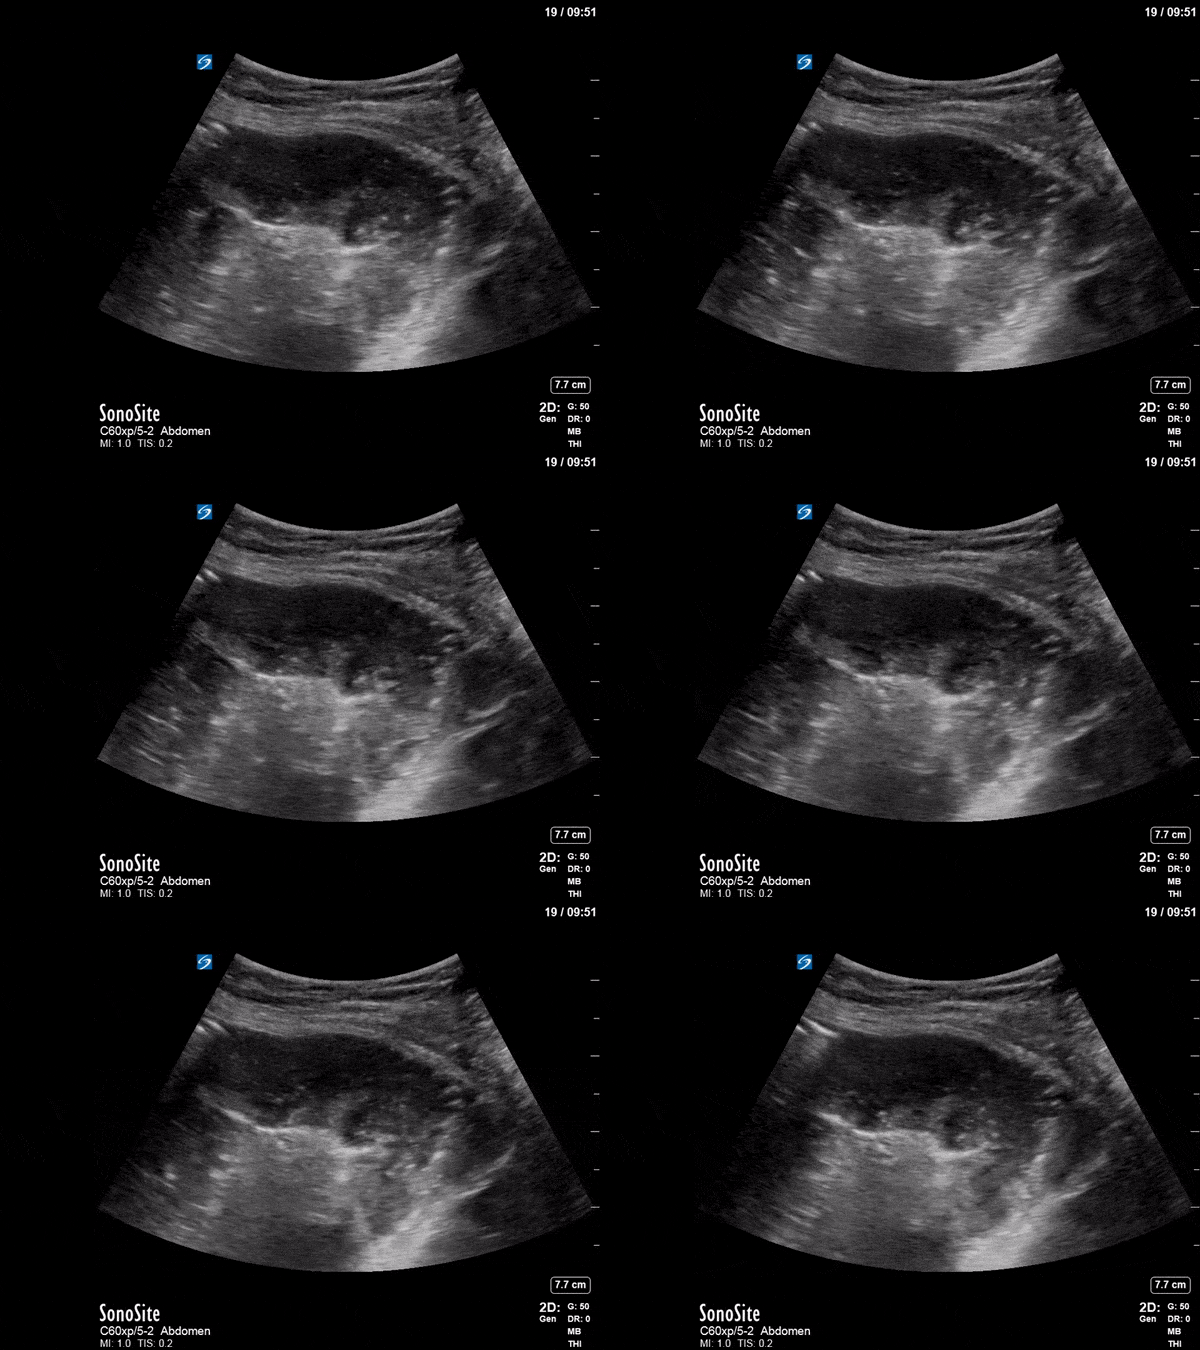
Firstly, here are his abdominal images. What can you conclude based on these clips?


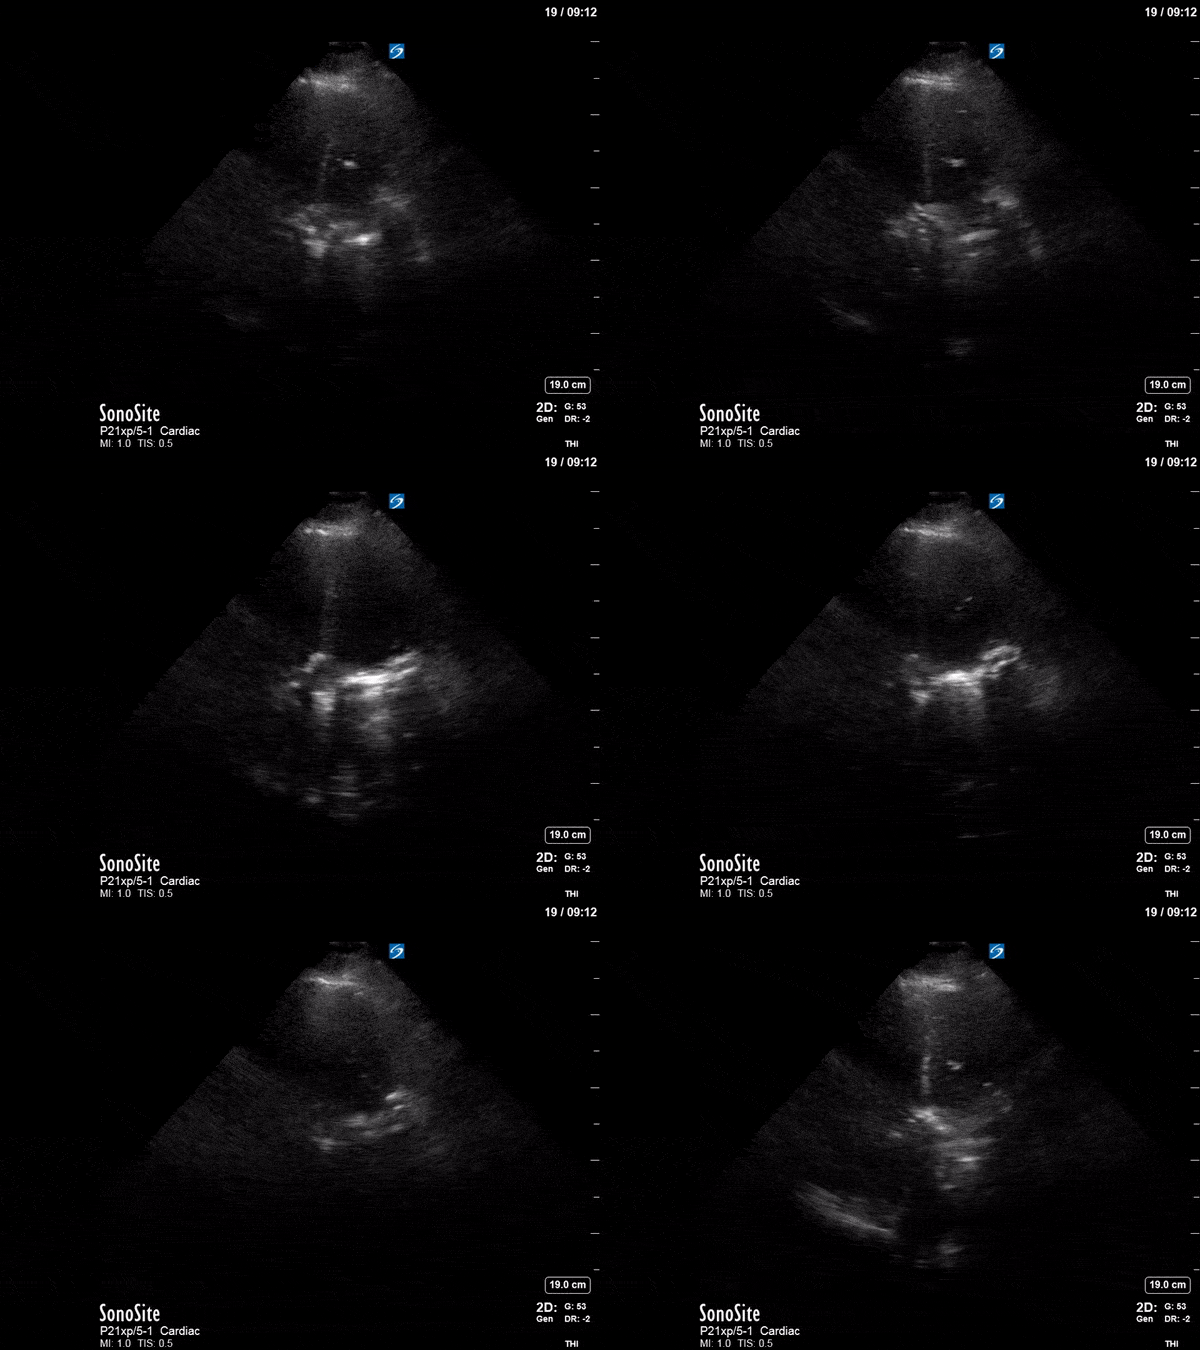
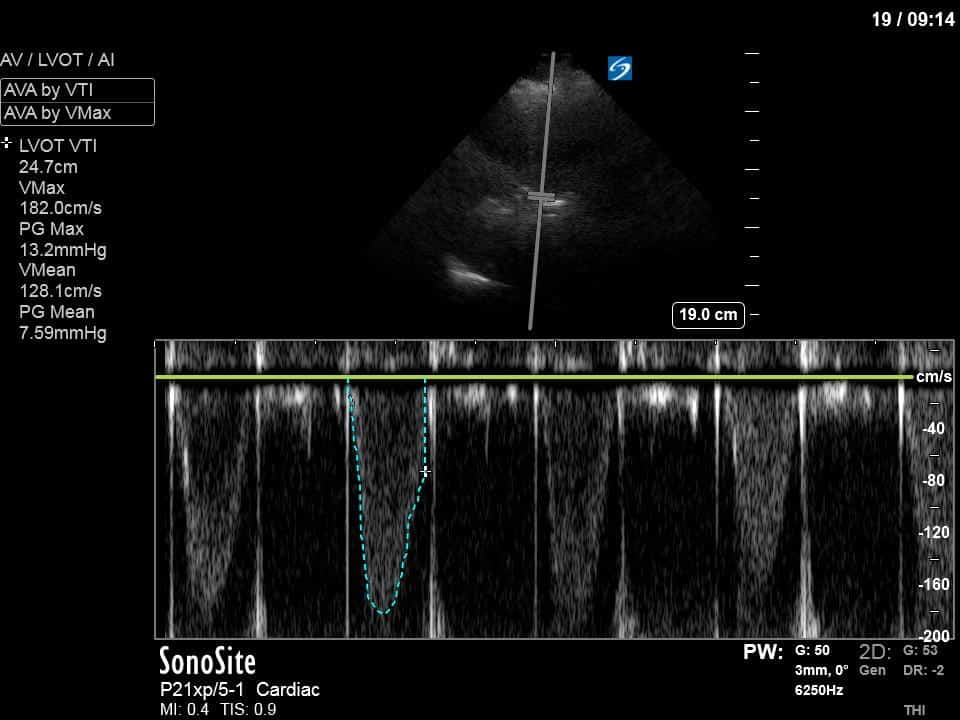
This gentleman also had a complex cardiac history significant for pulmonary hypertension and mechanical aortic and mitral valves. He became hypotensive shortly after admission, and the treating team was worried that this represented worsening RV failure Based solely on these two images, what can you tell them about the source of his shock?


First, the abdominal images. In the absence of pathology, normal ultrasound images of the abdomen should be unremarkable – because of the presence of air in bowel loops, we typically simply see artifact and can’t visualize the bowel itself. When the bowel becomes filled with fluid, however, we get beautiful pictures like the ones above where we can clearly see dilated loops of bowel (these were measured at 3.2cm; normal for small bowel is < 2.5cm). We also note free fluid surrounding the bowel loops in the first clip, which, in the context of dilated loops and bowel obstruction, is called the Tanga sign. In our second clip, we see a textbook demonstration of “to-and-fro” movement of bowel contents, which is highly specific for bowel obstruction.
Next, his hypotension – his A4C clip is challenging; we get a sense of a dilated R heart, as well as marked biatrial enlargement and hyperechoic shadowing from his two mechanical valves. Particularly in the context of pulmonary hypertension, Echo images like this can be very hard to interpret to determine the cause of shock. The key here lies in the spectral doppler tracing, which swiftly answers our clinical question. We have used PW Doppler to interrogate blood flowing out of the LVOT, and tracing the resultant waveform reveals a velocity-time integral (VTI) of 24.7cm. This is supra-normal; the normal range for LVOT VTI is 18-22. (For more on how to calculate stroke volume and cardiac output using LVOT VTI measurements, see the WesternSono tutorial here: https://westernsono.ca/screencasts/echo/stroke-volume-determination/).
This elevated VTI essentially excludes R heart failure as the cause of his hypotension. In RV failure and other causes of obstructive shock, the hemodynamic problem is a failure of the RV to deliver blood to the LV, leading to a low LVOT VTI and low cardiac output. In contrast, here we have a high LVOT VTI and high cardiac output, which is consistent with vasodilatory shock from sepsis.
In our gentleman’s case, he was found to have C. difficile colitis complicated by ileus (accounting for his abdominal images). General surgery was consulted but he was managed conservatively with antibiotics and bowel rest. His hypotension was a result of his sepsis, rather than worsened RV failure, and was treated with vasopressors.
That’s all for this week. Thanks for reading, and happy scanning!